Insolvency statistics released for August 2020
Latest company and individual insolvency statistics remain low overall following July’s spike in administrations.
The latest monthly release of insolvency statistics for England and Wales was published on 15 September 2020. *
Overall numbers of company and individual insolvencies remained low in August 2020, when compared with the same month in the previous year.
After reaching a post-lockdown peak in July, both administration and compulsory liquidation numbers for August were more in line with previous months since lockdown was implemented.
Impact of COVID-19 business support measures
The overall low numbers are likely to be at least partly driven by Government measures set up in response to the coronavirus (COVID 19) pandemic, including:
- Reduced court and tribunal operations and reduced HMRC enforcement activity since the UK lockdown was applied
- Temporary restrictions on the use of statutory demands and certain winding-up petitions (leading to company compulsory liquidations) from 27 April and extended to 30 September 2020 under the Corporate Insolvency and Governance Act
- Enhanced Government financial support for companies and individuals.
As the Insolvency Service does not record whether an insolvency is directly related to the coronavirus pandemic, it is not possible to state its direct effect on insolvency volumes.
The statistics in detail – August 2020*
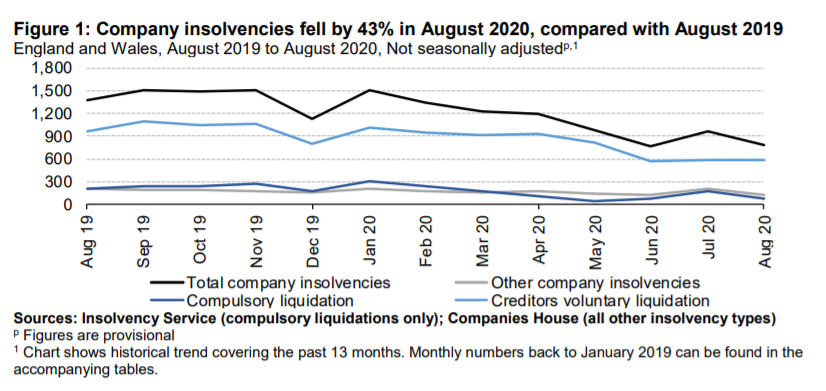
Company insolvencies
In August 2020 there was a total of 778 company insolvencies in England and Wales, comprised of:
- 586 creditors’ voluntary liquidations (CVLs)
- 66 compulsory liquidations
- 110 administrations
- 15 company voluntary arrangements (CVAs)
- 1 receivership appointment.
There were no receivership appointments.
The overall number of company insolvencies decreased by 43% in August 2020, when compared to the same month last year. This was primarily driven by a decrease in the numbers of CVLs and compulsory liquidations which fell by 39% and 67% respectively. There was a 50% decrease in the numbers of CVAs.
The reduction in company insolvencies is likely to be in part driven by the range of Government support put in place to support companies in response to the coronavirus (COVID 19) pandemic.
The number of companies entering administration in August 2020 decreased by 38% in comparison to August last year – this is despite an increase in administrations witnessed in the preceding month this year.
Debt relief orders and bankruptcies
There were 1,332 DROs in England and Wales representing a 31% reduction in August 2020, compared with the same month last year.
769 bankruptcies, made up of 708 debtor bankruptcies and 61 creditor bankruptcies, represent a 43% reduction compared with the same month last year. The reduction in bankruptcies was driven by a 36% fall in debtor bankruptcies and a 74% reduction in creditor bankruptcies.
How the numbers may be affected
The fall in DROs and debtor bankruptcies corresponds with a reduction in applications which coincided with the announcement of enhanced Government financial support for individuals and businesses.
The fall in creditor bankruptcies will likely have been a result of reduced HMRC enforcement activity during this period and in part, a result of reduced operational running of the courts.
Individual voluntary arrangements
There were 4,885 IVAs registered, on average, each month during the three months ending August 2020. This was 28% lower than the rolling three-month average observed in the period ending August 2019.
How the numbers may be affected
IVAs are counted once they are registered with the Insolvency Service and are reported by month of registration date. There can be a time lag between the date on which the IVA is accepted (the date of creditor agreement) and the date of registration by licensed insolvency practitioners. This can lead to volatility in the data from one month to the next and create difficulty in constituting reliable short-term trends.
In addition, recent statistics have been affected by technical issues experienced by an IVA provider. Three-month rolling averages have been calculated to smooth the data and indicate what the overall trend of IVA registrations might look like if the underlying data were less volatile.
Advice
We publish a summary of the reports here each month. For advice relating to support, insolvency or recovery options, please contact us.
* This content and data was reported in full in the Insolvency Service Statistics for August 2020, published 15 September 2020 – see the full report here: https://www.gov.uk/government/statistics/monthly-insolvency-statistics-august-2020
Image source: The Insolvency Service Monthly insolvency statistics, August 2020